Smart Grid Attack Detection and Localization

Using ensemble and representation learning to classify and localize attacks in smart power systems


Abstract

The integration of smart cyber-physical technology into critical infrastructure, such as the smart grid, has been accompanied with significant concerns regarding potential security threats. As such, much effort has been deployed toward securing the technology-reliant critical infrastructure. Among this work is the development and deployment of intrusion detection systems that can detect and, in some cases, identify attacks within the cyber-physical system. This project  proposes an intelligent attack detection and identification model the classifies the attack type based on an ensemble of machine learning methods. Furthermore, the proposed model localizes the attack or fault to specific features or measurements in the system to aid managers and users in mitigating the attack by narrowing its potential location.
The proposed model is tested on a power system multi-label data-set simulated by the Oakridge national laboratories and compared to traditional machine learning classifiers. The localization of attacks and faults is tested by splitting the data and measuring the correlation of the localization metrics produced by the proposed model. Results of this experiment demonstrate the effectiveness of the proposed method at classifying and localizing attacks.

Data

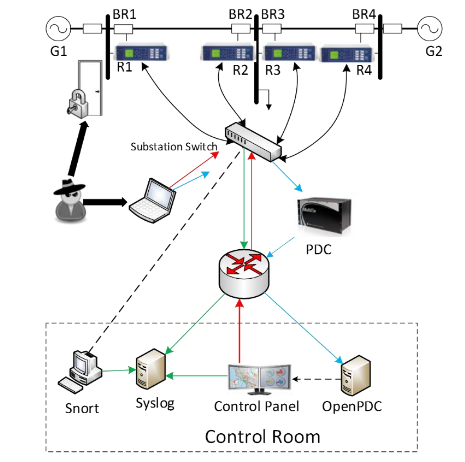
The power system framework used in this experiment consists of a complex mix of supervisory control systems interacting with various smart electronic devices. This system was created by the Oak Ridge National Laboratories. The system's network contains four breakers controlled by intelligent electronic relays and supervisory control and data acquisition systems.

The testbed system, seen in the figure to the right, contains several components including two power generators, G1 and G2, four Intelligent Electronic Devices (IEDs), R1 through R4, and their corresponding breakers labelled BR1 through BR4. The system also contains two transmission lines; line 1 spans from bus B1 to B2, and line 2 from B2 to B3. The IEDs in this system are equipped with a distance protection scheme which trips the breakers upon detected faults, whether valid or faked by an attack.

The data is generated from this system by activating it under various normal operations and different manipulations to simulate different attack types at various locations. These scenarios are summarized in the table to the right along with the associated labels of each scenario. In this dataset, the labels are numbers between 1 and 41 with the exception of the numbers 31 through 34 which are not used as labels. As such, there are a total of 37 labels, 36 scenarios and 1 normal.
Scenario Type Labels
Short-circuit fault Natural Event 1-6
Data injection Attack 7-12
Line Maintenance Natural Event 13-14
Remote Tripping Command Injection Attack 15-20
Relay Setting Change Attack 21-30, 35-40
Normal Operations Normal 41

Proposed Model: ERLC

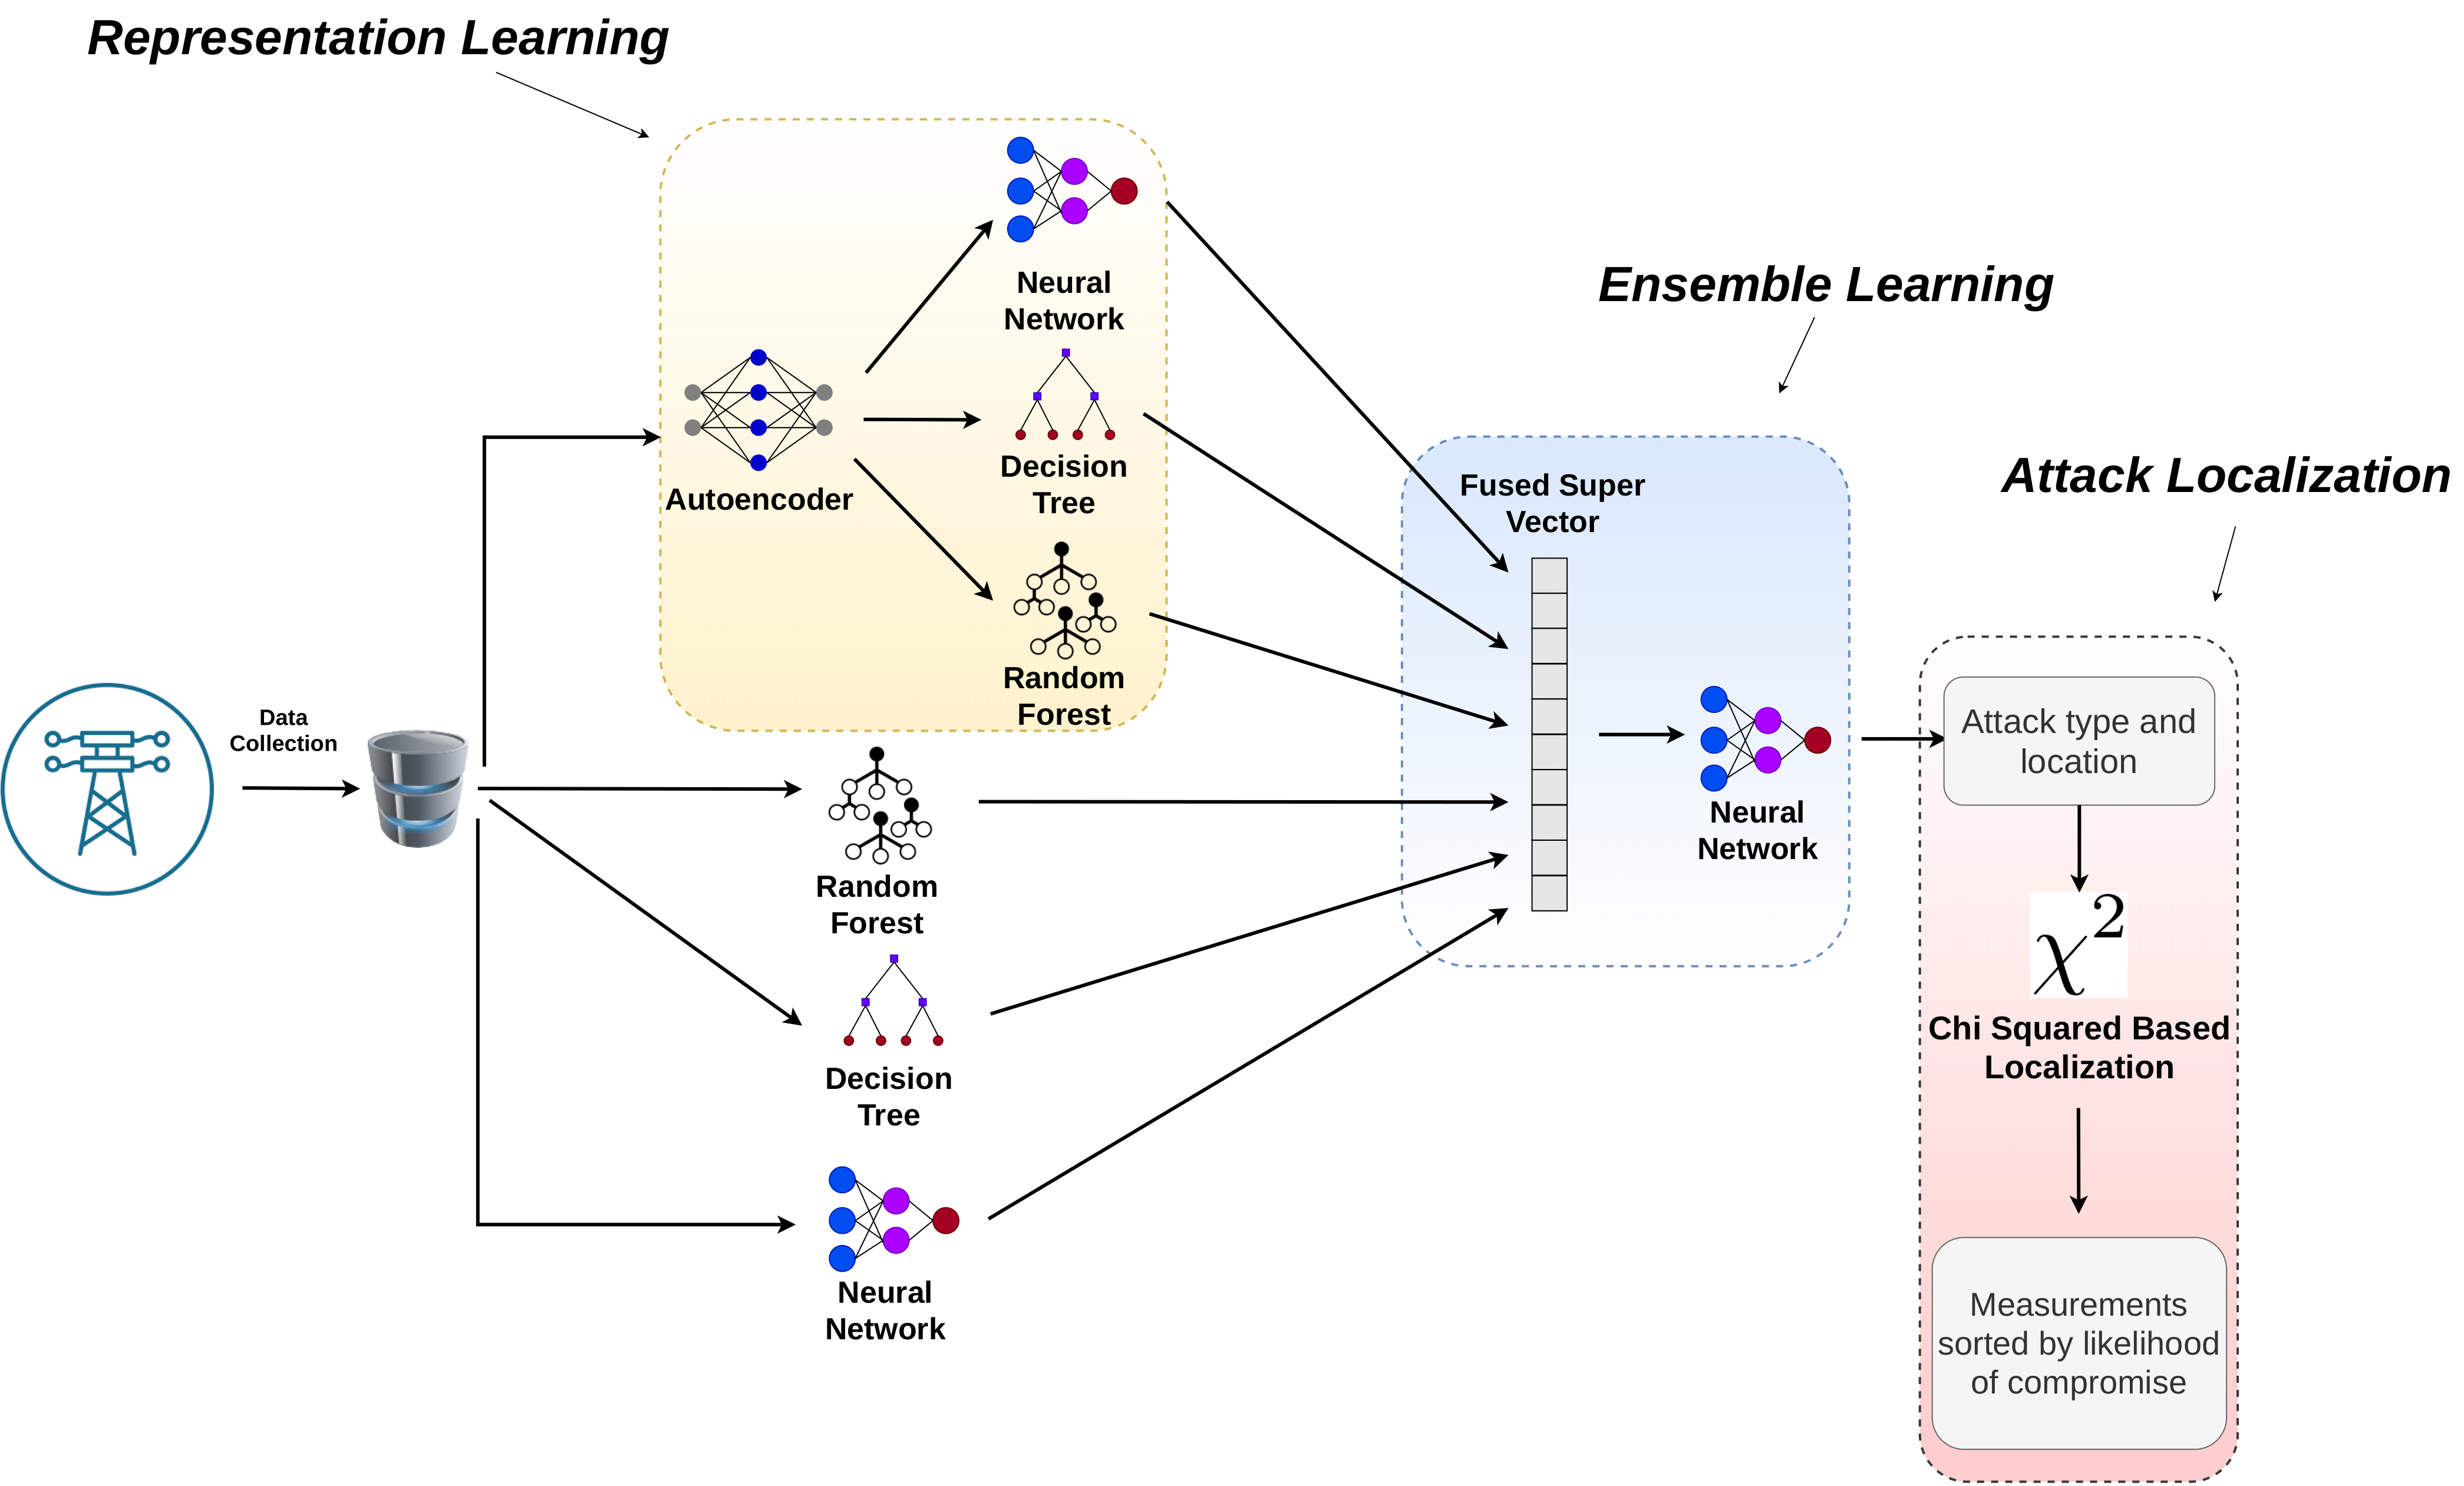
We propose an ML-based attack detection model, named Ensemble Representation Learning Classifier (ERLC), which utilizes representation and ensemble learning to maximize performance. The model is made up of multiple classifiers and neural networks as well as an attack localization algorithm that is based on the chi-square metric. The classifiers used in this model are a Decision Tree (DT) classifier, a Random Forest (RF) classifier, and a feed-forward Artificial Neural Network (ANN). These three classifiers were chosen due to their high performance on this dataset and on most systems of similar nature. The classifiers are combined for an enhanced performance. The architecture of this model can be seen in the figure to the right.

Results

The performance of our proposed ERLC model is compared to various standard ML classifiers. Most of these traditional classifiers did not perform well on this dataset. As such, we compared our model to the top three ML classifiers. These top three classifiers are Random Forest (RF) Classifier, Decision Tree (DT) classifier, and K-Nearest Neighbour (KNN) Classifier. To thoroughly test these models, we perform a 10-fold cross validation test in which the models are trained and tested on different parts of the data-set to ensure consistent performance. The result of this 10-fold cross validation test are in the figure to the right.

The results outlined in the figures to the right show superior performance of the proposed ERLC model when compared to the top three traditional ML algorithms as well as other papers in literature. The average accuracy of the ERLC model is 2.63 higher than that of the second best classifier, RF. The F1-score and MCC of the ERLC model are also 2.63 and 2.71 higher than those of the RF classifier respectively. Furthermore, the standard deviation, also recorded in this table, is smaller of the ERLC model for all metrics. This demonstrates superior consistency of the ERLC model as the performance metrics had the lowest variance throughout the 10-fold cross validation test.

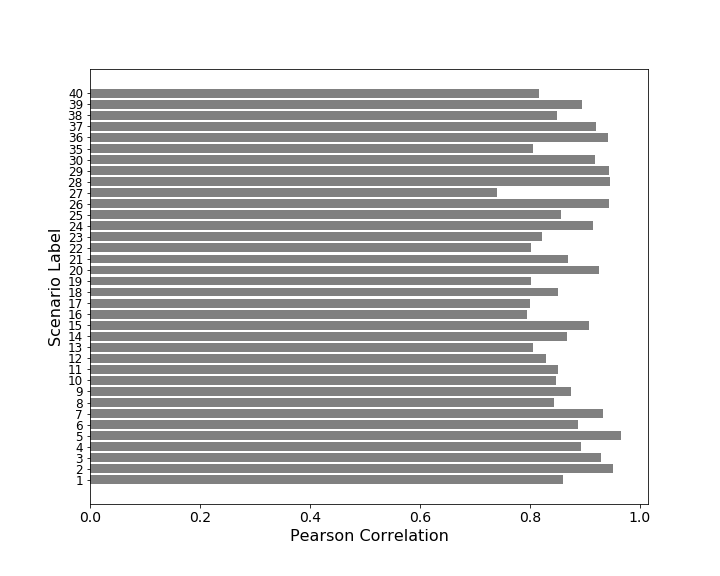
To quantify the effect of our proposed chi-based localization, we split that dataset into training and testing set, and we test the correlation between the resultant chi values of each attack. If the correlation of the chi vectors for each attack is high between the training and testing datasets, we can confirm the consistency in patterns of measurements for each attack. The Pearson correlation for each scenario label in the third figure on the right shows high correlation between the training and testing sets for the chi-based localization. The mean correlation of the chi-squared values of all features is 0.89 showing a strong overall correlation between the localization of the training data and the testing data. The maximum correlation was 0.97 for the scenario label of 39 which corresponds to a specific relay change in the power system. The minimum correlation found was 0.76 at the scenario label 19 which corresponds to a remote tripping command injection.

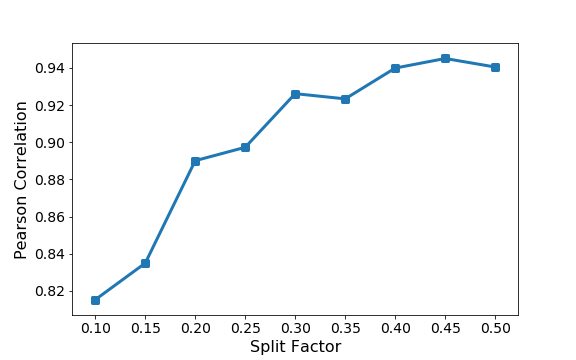
The robustness of this localization method to the data split is tested for varying split ratios from 0.1, meaning a 9-1 split, to 0.5, a 50-50 split. The correlation between the chi squared values of both sets was calculated for each scenario. The average correlation for all scenarios for each split is shown in the fourth figure on the right which demonstrates high correlation of the localization metric between the training and test sets for all split factors. The correlation increases with higher split factor due to the larger size of the test but that correlation is still significant for all split ratios. The strong correlation between the chi squared values of the training and test set shows that the chi-based localization is effective at determining the features associated with each scenario type. This means that the chi-squared test can be used as a localization metric to determine the location of the attack by identifying the measurements or features that are most likely affected by the predicted attack.

Conclusion

The results of this paper confirm the efficacy of the proposed ERLC algorithm at classifying attacks and fault scenarios and localize them to specific measurements within the system. Testing the ERLC algorithm on a multi-label dataset with 36 attack and fault scenarios demonstrated effective attack classification achieving 2.63 higher classification accuracy than the RF classifier, which is the second best of the ML classifiers tested. The performance of the ERLC model was also evaluated using a weighted F1-Score and MCC ranking 2.63 and 2.71 higher than RF respectively.

In addition to classifying the attack or fault scenario, the ERLC model is capable of localizing the scenario to a specific set of features or measurements. The ERLC model, unlike the traditional ML algorithms, sorts the features based on likelihood of infection. This sorting is achieved through the chi-squared test which ranks features based on their correlation to each label. The efficacy of this localization method is demonstrated through testing the correlation between the chi-squared values from the training and test sets, which are acquired through a random 80-20 split. A high correlation between the localization results, the chi-squared values, from the training and test sets was exhibited for all attack and fault scenarios indicating the effectiveness of the chi-squared-based localization. Furthermore, to ensure that the results are not biased to the specific data split, the average correlation was calculated for varying split ratios and confirmed the effectiveness of this method.

Future work can be done on this model to test it on multiple systems with varying topology. The proposed model can also be enhanced to incorporate real-time data, potentially through a Recurrent Neural Network (RNN) such as a Long Short Term Memory (LSTM) neural network which considers samples from past intervals necessitating time-sequenced data. Further work can also be done to incorporate network data potentially through adding a component to the ensemble model which is trained on network data alone. The overall structure of this model allows for many parameters to be tuned. Furthermore, the ensemble nature of this model allows for more classifiers to be added which can increase its performance on complex multi-view datasets.